48uep6bbphidvals|142
48uep6bbphidcol4|ID
48uep6bbph|2000F98CTab_Articles|Fulltext
Since the liver is the central site for the metabolism of various macro- and micro-nutrients, it is not surprising that diseases of the liver, leading to liver dysfunction, have major metabolic and nutritional impacts.(1)
Severe protein energy malnutrition (PEM) is common in patients with advanced liver disease, with a point prevalence of 10-100%(2) and alcohol has been suggested as an important cause.(3) Although PEM may not be solely responsible for liver injury in alcoholics, PEM, together with alcoholism, may facilitate the development of hepatic injury(4) and is considered a significant predictor of survival.(5,6)
Protein energy malnutrition is not only common in cirrhotics but also in alcohol addicts without liver disease.(7) Measured resting energy expenditure (MREE) has also been shown to be higher in alcohol addicts without liver disease as compared to patients with chronic liver disease,6 thus increasing the calorie requirements in alcoholics without liver disease.
Assessment of health-related quality of life (HRQL) is gaining importance as the impact of the disease on the patient’s well being and functioning may be enormous and this is true not only for patients with alcoholic liver disease but also for chronic alcoholics without liver disease.(2)
Thus, the present study was planned to assess and compare the nutritional status and HRQOL among cirrhotics (alcoholic and non alcoholic) and alcohol addicts without the evidence of liver disease and to evaluate the proposed role of ethanol and malnutrition in the pathogenesis and progression of liver disease.
Materials and methods
PATIENTS:
This was a prospective study carried out in a tertiary health care centre (Department of Gastroenterology and De-addiction Ward, Sawai Maan Singh Medical College, Jaipur, India) over a period of 4 months.
25 chronic alcoholics/alcohol addicts ( AA), 41 alcoholic cirrhotics/alcoholic liver disease (ALD), 40 non-alcoholic cirrhotics/non-alcoholic liver disease (NALD) and 25 healthy controls were randomly selected for the study.
The subjects were included in the study on the basis of the following criteria.
Subjects (both alcoholics and cirrhotics) who admitted to a regular daily intake of 20 g ethanol for the past 1 year but agreed to abstain from alcohol consumption during the study. However, detailed history of ethanol consumption revealed that actual ethanol intake in both the groups was much higher. Occasional or social drinkers were excluded.
Alcohol addicts were newly diagnosed patients who had no history of receiving any kind of de-addiction treatment (for alcohol, smoking or tobacco) in the past. (7)
Non-alcoholic cirrhotics were the patients with viral or cryptogenic aetiology.
The diagnosis of cirrhosis (ALD and NALD) was based on clinical, laboratory, endoscopic and/or histological criteria. Histological confirmation of liver cirrhosis was possible in only patients. Liver biopsy was obtained through the percutaneous route.
Patients showing signs of overt hepatic encephalopathy, severe ascites, active gastro-intestinal bleeding, renal failure (serum creatinine> 2.0 mg/dl), diabetes mellitus, psychiatric problems and malignant disease were excluded.
NUTRITIONAL ASSESSMENT:
Nutritional status was assessed by anthropometric measurements, biochemical estimations, dietary intake and measurement of urinary creatinine.
All the subjects were weighed and measured for height, in order to calculate Body Mass Index (BMI = actual weight [kg]/ height [m]2). Ideal body weight was calculated from values given by the Life Insurance Corporation of India.(8)
ANTHROPOMETRIC MEASUREMENTS:
Upper limb anthropometry was used for evaluation of malnutrition because of two main reasons, firstly, Body Mass Index was likely to be affected by the presence of ascites and secondly, lower limb measurements would also be influenced by oedema in case of cirrhotics and therefore, these 2 parameters were not used for the comparison of nutritional status with alcohol addicts and controls.
A flexible fibre glass tape (OHAUS Corp., Florham Park, USA) was used to measure the mid- upper arm circumference (MUAC). Measurement was taken at the mid point between the tip of acromian and olecranon process. Skin fold thickness at triceps or fat fold at triceps (FFT) was determined using Harpenden’s skin fold caliper (British Indicators Ltd, Bedfordshire, England). Both the measurements were taken by a single observer. From the values obtained for mid-upper arm circumference (MUAC) and fat fold at Triceps/Triceps skin fold (FFT/ TSF), mid-arm muscle circumference (MAMC), mid-arm muscle area (MAMA) and mid-arm fat area (MAFA) were calculated using the following formulae:
MAMC = [MUAC – (3.14 X FFT)]
MAMA = [(MUAC – 3.14 X FFT)2 / 4 X 3.14]
MAFA = [(FFT X MUAC)/ 2 – 3.14 X (FFT)2/ 4]
Values obtained were compared with an age and sex matched population and values of MAMA below the 5th percentile of the cut offs were taken as significant malnutrition.(9)
Blood investigations included routine laboratory tests (blood sugar, haemoglobin, kidney function tests) and liver function tests. These were analysed using the standard techniques and were done prior to inclusion in the study and also during the evaluation period.(10)
Dietary intake was assessed by the 48 hour recall method. Total energy and macronutrients (carbohydrates, proteins and fats) were calculated for both groups. The ideal daily energy requirement, for patients in both groups was estimated by calculating Resting Energy Expenditure (REE) by Harris-Benedict’s equation. To increase the accuracy of the estimate, an injury factor of 1.3 was included for patients with liver disease (ALD and NALD) to accommodate for the increased caloric need resulting from their disease. Ideal protein requirement for cirrhotics (both alcoholic and non-alcoholic) ontrols, was taken as 1.0 g/kg ideal body weight.(11,12) Ethanol intake was expressed per unit of body weight. Alcohol calories were not included in the total calories (only dietary calories were used for the assessment and comparison in order to avoid over estimation) while comparing with the ideal caloric intake in all the groups.
Clinical severity was classified according to Child Pugh’s classification (CP score).(13)
Health Related Quality of Life (HRQL) was assessed in all the study groups using the SF-36 questionnaire.(14)
Statistical Analysis was done using Statistical Package for Social Sciences (SPSS, ver.10 inc. Chicago, USA). Data was expressed in the form of mean ± SD. Differences between the groups were determined by using Student’s unpaired t test and ANOVA for quantitative data and the chi square test for qualitative data. Pearson’s product moment method (r) method was used to study correlation between 2 variables. Logistic regression analysis was used to identify factors significantly associated with perceived disease progression. A p value<0.05 was considered to be statistically significant in all analyses.
.jpg)
Fig. 1: Percentage of patients with nutrient deficiency
Statistics (between 3 groups):
a p=0.0 (calorie deficiency); b p=0.0 (protein deficiency); c
p=0.1 (Carbohydrate deficiency); d p=0.3 (fat deficiency).
1Cals=calorie deficiency; 2Pros= protein deficiency; 3CHO=
carbohydrate deficiency; 4Fats=fat deficiency
Results
All patients selected for the study were male. Of the 40 non-alcoholic cirrhotics, 9 (22.5%) patients had viral aetiology and for the rest (77.5%), no cause could be ascertained.
Mean age was highest in NALD patients followed by ALD and AA and controls were 10 years younger than NALD. Disease severity by CP score was highest in ALD patients (Table 1).
There was no significant difference in the total ethanol intake (g/kg IBW) among AA and ALD patients (Table I). The total ethanol intake/day among ALD patients was not significantly different from patients with Child’s C (2.0 ± 1.8 g/kg/d) and patients with Child’s B liver disease (2.6 ± 2.3 g/kg/d); (p= 0.3).
Daily caloric requirement was highest in ALD patients followed by NALD and lowest in AA, similar to that of the controls. This may be because of multiplication with correction factor of 1.3 in the cirrhotic group. Daily protein requirement also showed the same pattern because the protein requirement for cirrhotic patients was taken as 1.2 g/kg/IBW/day and that for AA and controls was taken as 1.0 g/ kg IBW/day (Table I).
Daily fat intake was highest among the control group, followed by ALD, AA and NALD. Controls had the highest consumption of proteins amongst all the four groups, followed by AA, ALD and NALD respectively. The total calorie (p=0.6) and carbohydrate intake (p=0.07) did not show any significant difference among the three study groups, but were significantly lower than the controls (Table I).
We determined the frequency of patients in all groups with nutrient deficiency (i.e. the number of patients with the percent mean daily intake below 100%). The frequency of nutrient (energy, protein, carbohydrate and fat) deficiency was lowest in the control group in comparison to the other three patient groups (Figure 1). Calorie deficiency was seen in all patients belonging to ALD and NALD groups, however, only 88% AA were calorie deficient (p= 0.0). There was no significant difference in the frequency of carbohydrate and fat deficiency among the three patient groups (Figure 1). Frequency of protein deficiency was significantly higher in NALD patients (100%), as compared to ALD and AA groups.
Clinical severity according to CP score was significantly higher in ALD (10.15± 1.62) patients in comparison to NALD (9.70± 1.62) (p= 0.00). Severity of disease, to some extent, also affected the dietary intake of patients with alcoholic liver disease. Total calories showed no significant correlation with Child’s score but total protein and fat showed significant negative correlation with Child’s score (r= -0.3; p= 0.0; r= -0.4; p= 0.0, respectively) in the ALD group. Mid arm muscle area (MAMA), an indicator of muscle mass was significantly lower in the ALD group in comparison with AA and NALD and the control group had the highest MAMA of all the four groups. Mid arm fat area (MAFA), an indicator of fat stores was not significantly different between the three groups but was significantly higher in the controls (Table I).
Table I: Demographic, anthropometric, dietary & clinical profile of the study groups
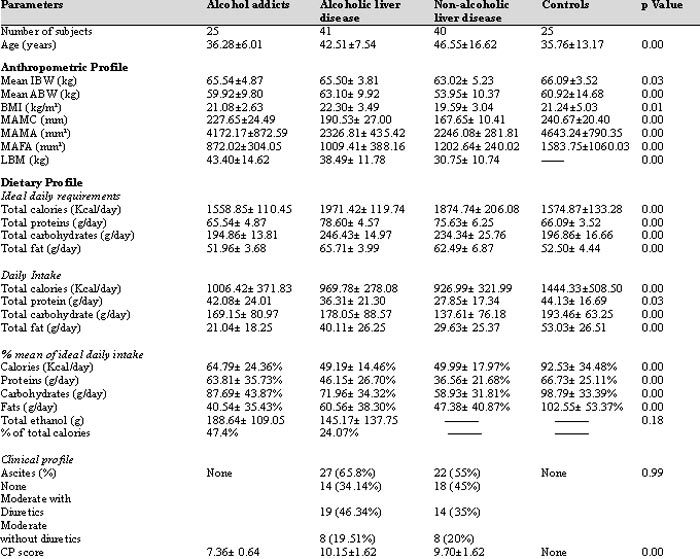
AA- alcohol addicts, ALD- alcoholic liver disease, NALD- non- alcoholic liver disease, IBW- ideal body weight, ABW- actual body weight, BMI-
body mass index, MAMC- mid-arm muscle circumference, MAMA- mid-arm muscle area, MAFA- mid-arm fat area, LBM- lean body mass
Our patients were defined as malnourished when the MAMA lay below the 5th percentile of an age and sex matched population as described by Merli et al.15 44% controls, 60% AA, 90% patients with NALD and 100% of patients with ALD were malnourished when assessed by the above-mentioned criteria (chi square= 22.2; degrees of freedom= 2; p= 0.00). MAMA showed no correlation with Child’s score in any of the cirrhotic group (ALD r= -0.1; p= 0.3; NALD r= -0.2; p= 0.1) but showed a significant positive correlation with the total calorie intake in all the three study groups (ALD r= 0.31; p= 0.04; NALD r= 0.3; p= 0.04; AA r= 0.4; p=0.03). Also, total calorie intake was deemed an independent predictor of muscle area in ALD (p= 0.04) and AA (p= 0.02) groups.
Serum albumin was significantly lower in the ALD group (3.26± 0.42 g/dl) when compared with the AA (3.55± 0.42 g/dl) and NALD (3.26± 0.42 g/dl) groups; (p= 0.000). ALD patients had significantly higher serum bilirubin levels as compared with the NALD and AA groups; (p= 0.02). CP score negatively correlated with the serum albumin levels in ALD patients (r= -0.66; p= 0.00)
Cirrhotics (irrespective of aetiology) scored significantly lower on the QOL (SF-36) scale as compared to addicts and controls (Table II). Nearly the same frequency of patients with alcoholic liver disease (41.4%) and non-alcoholic liver disease (45%) reported poor health (chi square= 0.10; p= 0.74), whereas only 4% alcohol addicts and none of the controls scored the same (chi square= 26.57; p= 0.00 – for all the study groups). We did not find any significant association of QOL domains with Child’s score, MAMA, total dietary intake and total ethanol intake in patients with alcoholic liver disease and in alcohol addicts. In non-alcoholic liver disease patients, the role of physical activity positively correlated with the total calorie intake (r= 0.32; p= 0.0) and total fat intake (r= 0.36; p= 0.0).
However, muscle area in all the three study groups positively correlated with the total calorie intake (which was below the ideal intake) (Table III) and therefore, PEM in these patients, with or without liver disease, may be a result of poor dietary intake.
Discussion
Results of the above study indicate that malnutrition is a common finding, not only in patients with liver disease (irrespective of aetiology) but also in chronic alcoholics without liver disease; with greater frequency and severity among the ALD patients.
Table II: QOL profile of study groups

a p value< 0.00, p value significant for all four groups. QOL- quality of life, AA- alcohol addicts, ALD- alcoholic liver disease,
NALD- non-alcoholic liver disease
As is evident from Table I, total ethanol intake was similar in both ALD and AA. Also, ethanol intake did not vary with disease severity in ALD patients and the Child’s score did not show significant correlation with the total ethanol intake in patients with alcoholic liver disease (p= 0.11). From these observations, we may draw two main conclusions – firstly, ethanol consumption may not be the sole contributing factor in the pathogenesis/ development of liver disease and secondly, total ethanol consumption may not result in higher disease severity in cirrhotics.
Protein energy malnutrition (PEM) in the two alcoholic groups (ALD and AA) may not be related to the total alcohol intake as none of the parameters taken for the evaluation of malnutrition (MAMA/ MAFA) correlated with the total ethanol intake. The degree of malnutrition was similar among ALD and NALD patients. AA patients were less malnourished as compared with the 2 cirrhotic groups, thus to rule out the effect of ethanol on the nutritional status of these patients.
Total ethanol intake was not different in patients with Child B or Child C alcoholic liver disease. This finding is in contrast with that of a similar Indian study.(16) We found that the muscle area correlated positively with the total calorie intake. This finding was in accordance with that of Sarin et al.(16)
In patients with ALD, a negative correlation was found between total protein and fat intake and CP score. Since the CP score was highest in ALD patients as compared with the other 2 groups, dietary intake in these patients to some extent was limited by the disease severity, resulting in impairment of the nutritional status in this patient group. However, no such correlation was found in the other 2 study groups.
Serum albumin levels were low in both ALD and NALD patients indicating poor synthesis of albumin by the diseased liver in these patients, but were maintained in addicts without liver disease. It therefore appears to indicate that alcohol per se may not be responsible for lower albumin levels in this cohort of patients. Low levels of albumin may then be attributed to poor dietary intake, protein deficiency and disease severity, resulting in the malfunctioning of the liver and resultant poor synthesis of albumin by the liver.
HRQOL scores were significantly lower in the liver disease group (irrespective of aetiology) when compared with alcohol addicts. Frequency of patients with regards to perception of general health was similar in both ALD and NALD groups. This can be attributed to malnutrition, higher disease severity and poor nutritional intake in ALD patients but there was no significant correlation between any of these parameters.(2) This could possibly result from the small sample size of the study groups.
Table III: Relationship of MAMA with ethanol intake, dietary intake and disease severity
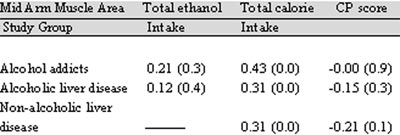
a p value< 0.05; 1 values outside the parenthesis is correlation
coeffecient (r). MAMA- mid-arm muscle area, QOL- quality of life, CP- Child Pugh’s
In conclusion, our results indicate that malnutrition is a common finding among patients with liver disease and in alcoholics without liver disease. The severity and frequency is greater in alcoholics with liver disease. Pathogenesis of liver disease and malnutrition may not be solely related to alcohol intake, but other factors may have an important role to play; for example genetic, immunological, metabolic, and apparent viral hepatitis. Reductions in nutritional status and QOL may be because of poor dietary intake and liver disease. There is a possibility that any of these factors may make the liver more sensitive to the toxic effect of ethanol.(7) However, predicting liver disease is still not possible as total ethanol consumption and dietary factors may not be solely resposible in determining liver cirrhosis and therefore further research is required.
There were certain drawbacks of the study. Histological evidence of the stage of liver cirrhosis was not available for all patients. Also the sample size of the groups was too small to generalise the results. Since alcohol addicts were also malnourished, there is a need to formulate of guidelines concerning dietary requirements, methods for assessment of nutritional status and specific QOL scales in this patient group.
References
1. Nompleggi DJ, Bonkovsky HL. Nutritional supplementation in chronic liver disease: an analytical review. Hepatology. 1994;19:518–33.
2. Marchesini G, Bianchi G, Merli M, Amodio P, Panella C, Loguercio C, et al. Nutritional supplementation with branched chain amino acid in advanced cirrhosis: a double blind randomized trial. Gastroenterology. 2003;124:1792–801.
3. Morgan MY. Alcohol and Nutrition, Br Med Bull. 1982;38:21–9.
4. Mendenhall CL, Anderson S, Weesner RE, Goldberg SJ, Crolic KA. Protein calorie malnutrition associated with alcoholic hepatitis. Veterans Administration Cooperative Study Group on Alcoholic Hepatitis. Am J Med. 1984;76:211–22.
5. Halsted CH. Nutrition and alcoholic liver disease. Semin Liver Dis. 2004;24:289–304.
6. Jhangiani SS, Agarwal N, Holmes R, Cayten CG, Pitchumoni CS. Energy expenditure in chronic alcoholics with and without liver disease. Am J Clin Nutr. 1986;44:323–9.
7. Simko V, Connell AM, Banks B. Nutritional status in alcoholics with and without liver disease. Am J Clin Nutr. 1982;35:197–203.
8. Sharma R. Diet Management, second edition, B.I. Churchill Livingstone Pvt Ltd, New Delhi, 1999; pp:114.
9. Frisancho AR. New Norms of upper limb fat and muscle areas for the assessment of nutritional status. Am J Clin Nutr. 1981;34:2540–5.
10. Kratz A, Sluss PM, Januzzi JL Jr, Lewandrowski KB. Appendices: Laboratory values of clinical importance. In: Kasper DL, Braunwald E, Fauci A, Hauser SL, Longo DL, Jameson JL, editors. Harrison’s Principles of Internal Medicine. 16th edition, volume II, A–11.
11. Nielsen K, Kondrup J, Martinsen L, Stilling B, Wikman B. Nutritional assessment and adequacy of dietary intake in hospitalized patients with alcoholic liver cirrhosis. Br J Nutr. 1993;69:665–79.
12. Plauth M, Merli M, Kondrup J, Weimann A, Ferenci P, Müller MJ, et al. ESPEN guidelines for nutrition in liver diseases and transplantation. Clin Nutr. 1997;16:43–55.
13. Pugh RN, Murray-Lyon IM, Dawson JL, Pietroni MC, Williams R. Transection of the oesophagus for bleeding oesophageal varices. Br J Surg. 1973;60:646–9.
14. Ware JE Jr, Sherbourne CD. The MOS 36-item short-form health survey (SF-36). I. Conceptual framework and item selection. Med Care. 1992;30:473–83.
15. Merli M, Riggio O, Dally L. Does malnutrition affect survival in cirrhosis? PINC (Policentrica Italiana Nutrizione Cirrosi). Hepatology. 1996;23:1041–6.
16. Sarin SK, Dhingra N, Bansal A, Malhotra S, Guptan RC. Dietary and nutritional abnormalities in alcoholic liver disease: a comparison with chronic alcoholics without liver disease. Am J Gastroenterol. 1997;92:777–83.