48uep6bbphidcol2|ID
48uep6bbphidvals|1734
48uep6bbph|2000F98CTab_Articles|Fulltext
Introduction
Focal liver lesions are being diagnosed at increasing rates with the increasing use of cross sectional imaging procedures.
1 Contrast-enhanced computed tomography (CT) and magnetic resonance imaging (MRI) are used to characterize these lesions by depicting different enhancement patterns of the lesions. Biopsy provides definitive diagnosis; however, it is invasive and has haemorrhagic complications and chances of false negative reports.
Computed tomography is widely available and represents an important method for the detection and characterisation of focal liver lesions. Multi-detector CT allows fast data acquisition over a large anatomic area with isometric voxels and superior spatial resolution. The shorter scan times in multi-detector triphasic CT allow scanning of the entire liver in different phases, including the arterial phase, the portal venous phase and the delayed phase which enables good characterization of focal lesions. The portal phase is the most sensitive phase for detection of focal liver lesions whereas the arterial and delayed phases provide information useful for characterizing the lesion.
2 Peripheral nodular enhancement (iso-attenuating with vascular structures) during arterial phase has positive predictive value (PPV) and specificity of 86% and 99% respectively for hemangioma.
3 Arterial phase hypervascularity and delayed phase hypovascularity has a specificity of 99% for the diagnosis of hepatocellular carcinoma.
4 This technique is widely accepted for the detection and characterization of focal liver lesions.
In recent years, there has been an increasing interest in the assessment of elasticity of tissues using the newly developed technique of ultrasound elastography. It is a rapid and non-invasive technique based on the comparison of signals acquired before and after tissue displacement. It is now widely used in the ultrasound diagnosis of diseases of the breast, thyroid, liver, prostate, blood vessels and musculoskeletal structures.
5-10 It is available in various forms, including transient elastography (TE), real time elastography and acoustic radiation force impulse (ARFI) elastography. In the liver, TE (Fibroscan) is used to measure liver fibrosis by quantifying liver stiffness. However, it is inappropriate for the evaluation of focal liver lesions as it does not provide the corresponding image and cannot reveal the accurate location of the lesion leading to sampling errors.
11 Real time elastography provides color coded images (blue, green and red) which reflect the elasticity of the liver lesions; however, the absence of a standardized quantitative measurement limits its usefulness in the evaluation of liver lesions.
12 ARFI elastography is a technique which provides both 2D images and numerical measurements of tissue stiffness.
13 It is performed under direct visual guidance and is a suitable method for the quantification of stiffness of focal liver lesions. Virtual Touch Tissue Quantification in ARFI imaging (VTQ) uses high-energy, short duration (<1 millisecond) acoustic pulses to excite the tissue in the region of interest (ROI), and these pulses displace soft tissue between 1 and 20 µm. The displacements lead to generation of shear waves which travel perpendicular to the acoustic push pulse. By observing the shear wavefront at several locations, and correlating these measurements with the elapsed time, the shear wave velocity (SWV in m/s) is measured. The SWV of the lesion is obtained by placing the fixed size ROI within the lesion. The shear waves propagate faster in stiffer tissues like malignant lesions. Thus, the stiffer the region, the greater is the SWV. The main advantages of this technique are its operator independence, reproducibility, and quantitative assessment of tissue elasticity.
14 It is a promising diagnostic technique for the differentiation of benign focal lesions from malignant ones.
15 This study evaluated the role of ARFI and triphasic CT in focal liver lesions.
Methods
A cross sectional study was done. Thirty eight adult patients of either sex with focal liver lesions detected on ultrasound were included in this study. Patients with purely cystic liver lesions and those with contraindications for performing contrast enhanced CT were excluded from the study. Relevant clinical details (complete history, general physical and systemic examination) and biochemical investigations (haemogram, liver function tests, kidney function tests, HBs antigen, Anti HCV, AFP) were noted. The study was approved by the institutional ethics committee and review board. Informed consent in vernacular language was taken in every case.
Computed tomography
Triphasic CT of the abdomen was performed on a 128 slice multi-detector CT scanner (Siemens Somatom, Definition AS+). The CT protocol included acquisition of non-enhanced scans followed by arterial, portal venous and delayed phase images. Each patient was given non-ionic contrast material (Iomeprol, concentration - 400 mg/ml) at a dose of approximately 1 ml/kg. The contrast was administered using a dual head pressure injector system at the injection rate of 4-5 ml/s. Scanning during each phase was performed in the cranio-caudal direction during a single breath-hold at deep inspiration. The injection-to-scan delay for early arterial phase imaging was determined using bolus tracking technique. The early arterial scans were taken after the achievement of 100 HU attenuation in the descending aorta. Late arterial scans were taken after a delay of 5 seconds (from early arterial phase) and portal venous phase scans were taken after a further delay of 20 seconds. Delayed phase scans were taken 3 to 5 min after the start of contrast injection.
The images were evaluated for number of lesions, location of lesions, margins, vascular involvement, presence of calcification or haemorrhage (on unenhanced phase) and enhancement pattern of the lesion in arterial, portal and delayed phase images. Enhancement of the lesion was described in terms of the attenuation of the lesion with respect to the hepatic parenchyma asisodense, hyperdense or hypodense. The images acquired in different phases were evaluated in order to characterise the lesion.
ARFI elastography
The elastographic examination was done using an Acuson S2000 ultrasound system (Siemens Medical solutions). A curvilinear transducer array operating at 2 to 4 MHz was used. Grey scale ultrasonography and Doppler were performed and the size, margins, echo pattern and the internal vascularity of the lesion were evaluated. ARFI imaging using virtual touch tissue quantification (VTQ) was the elastographic technique used in all the patients. Scanning was done through the intercostal or subcostal space according to the location of the lesion. After activating the VTQ, the VTQ region of interest (ROI) was obtained which is a rectangle with fixed dimensions of 10 mm x 6 mm and a maximum depth of 8 cm. It was entirely included in the focal lesion. The shear wave velocity (SWV, in m/s) was measured in a central window of 5 mm axial by 4 mm width within the ROI. In patients with multiple lesions, the largest lesion was evaluated to obtain the SWV values. To reduce respiration-related tissue motion in the ROI, all quantification was performed during breath-hold. In lesions with heterogeneous echo texture, an attempt was made to avoid the areas where the ARFI values might differ such as regions of calcification. For hepatic lesions, at least five SWV values were obtained from different areas within the lesion. Median SWV value was used as a representative value of the five SWV values of hepatic lesions. Similarly, for the surrounding hepatic parenchyma, five SWV values were obtained and the median value was used as a representative value. FNAC and histopathological diagnosis, which served as gold standard, was obtained in all cases except for hemangioma. For hemangioma, the diagnosis was established on the basis of characteristic findings on ultrasound and MRI with no change in the size of the lesions for 6 months on follow-up imaging.
ARFI measurements of the focal hepatic lesions and triphasic CT findings were correlated with FNAC/histopathological diagnosis.
Statistical analysis
Statistical analysis was done using Medcalc software (version 12.2.1.0). Receiver operating characteristic curve (ROC) analysis was done to obtain the cut-off value of SWV for differentiation between benign and malignant hepatic lesions and sensitivity, specificity, positive predictive value and negative predictive value were calculated using these cut-offs.
Results
A total of 38 patients (15 male, 23 female) with focal liver lesions were included in the study. The mean age of the patients was 49±11 years (range 30-73 years). There were 12 benign lesions in the study which included nine cases of hemangioma, one case each of hepatocellular adenoma (HA), focal nodular hyperplasia (FNH) and abscess. There were 26 malignant lesions including eight cases of hepatocellular carcinoma (HCC), two cases of cholangiocarcinoma and 16 cases of metastasis,.
Benign lesions
The mean age of the twelve patients with benign lesions was 48 ±11 years (range 32-65years). Eight patients had a single lesion while 4 patients had multiple lesions (mean number of lesions -1.8). The mean size of the lesions was 5.8 ± 3 cm (range 2.4-12.8 cm).
Triphasic CT
The enhancement pattern of benign lesions is presented in Table 1.
ARFI elastography
The mean SWV of benign lesions was 1.775±0.488 m/s (range 1.27-2.86 m/s). The mean SWV in surrounding liver parenchyma was 1.513±0.170 m/s (range 1.18-1.77 m/s). There was no significant difference in the mean SWV between the benign lesions and the surrounding liver parenchyma (p=0.09) (Table 2).
Malignant lesions
The mean age of the 26 patients with malignant lesions was 50 ±11 years (range 30-73years). Nineteen patients had multiple lesions while 7 patients had a single lesion. The mean size of the lesions was 7 ± 3.9 cm (range 2- 14.7 cm).
Triphasic CT
The enhancement pattern of the malignant lesions is mentioned in Table 3.
ARFI elastography
The mean SWV of malignant lesions was 3.271±0.561m/s (range 1.95-4.3 m/s). The mean SWV in surrounding liver parenchyma was 1.779±0.501 m/s (range 1.19-3.11 m/s). Significant difference was found in the mean SWV between the malignant lesions and surrounding liver parenchyma (p<0.0001) (Table 4).
Triphasic CT correctly diagnosed 96.2% of the malignant lesions. One lesion of metastasis was incorrectly diagnosed as focal nodular hyperplasia on triphasic CT. All the benign lesions were correctly diagnosed by triphasic CT. The sensitivity and specificity of triphasic CT for malignancy in liver lesions was 96.2 % and 100% respectively.
On ARFI elastography, mean SWV value for malignant lesions (mean ± SD, 3.271±0.561) was significantly higher than that for benign lesions (1.775±0.488). The optimal cut-off SWV value, with the highest sensitivity and specificity for malignancy in liver lesions, was estimated to be 2.44 m/s using the receiver operating characteristic (ROC) curve analysis. Using the ROC curves with this cut-off value (>2.44 m/s), the SWV value predicted malignancy with a sensitivity of 92.3%, specificity of 91.7%, positive predictive value of 96%, negative predictive value of 84.6%, accuracy of 92.1% with an area under curve (AUC) of 0.968 (Table 5, Figure 1).
Discussion
The study described was undertaken to evaluate and characterise focal liver lesions using triphasic CT and ARFI elastographyto differentiate benign and malignant focal liver lesions.
Benign lesions
On triphasic CT, nine cases of haemangioma were evaluated. All the haemangiomata were hypodense on NCCT with peripheral nodular enhancement iso-attenuating to the aorta during arterial phase (AP). During portal venous phase (PVP), most of the hemangiomas showed centripetal fill in of contrast and became isodense on delayed phase (DP) scans (
Figure 2). Nino Murcia et al reported that in hemangiomata, peripheral nodular enhancement has a PPV and a specificity of 86% and 99% respectively.
3

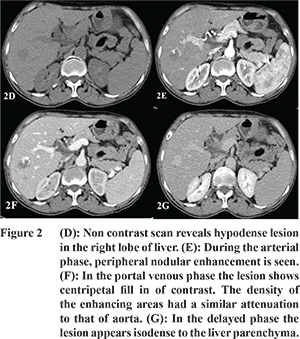
The mean SWV of haemangiomata in our study was 1.77 ± 0.49 m/s (
Table 2). Park et al reported that low values are seen in haemangiomata because they are composed of multiple blood filled vascular spaces and have low stiffness.1 No significant difference was found in the mean SWV of haemangiomata compared with the surrounding liver parenchyma. The mean SWV of haemangiomata was significantly low compared to the mean SWV of malignant lesions. Davies and Koenen found a significant difference in SWV of haemangiomata (1.35 ± 0.48 m/s) and metastases (4.23 ± 0.59 m/s).
13 Only one out of nine hemangiomas displayed a higher SWV value of 2.86 m/s suggesting stiff nature of the lesion. The lesion showed the characteristic enhancement pattern of a cavernous haemangioma on triphasic CT with non-enhancing area suggestive of thrombosis. High SWV value in this case can be explained by the pathologic patterns of haemangiomas. As haemangiomas undergo degeneration, thrombosis, calcification or fibrosis may occur resulting in increased stiffness. Similar findings have been reported by Heide and colleagues who found that the hemangiomas which showed high SWVs were partly thrombosed.
16 Hepatocellular adenoma and FNH were hypervascular in AP and isoattenuating in PVP. During DP scans, adenoma was hypoattenuating to the liver parenchyma whereas FNH was isoattenuating with minimal enhancement of the central scar (
Figure 3 and 4). Grazioli et al in their study reported that adenomas usually show arterial phase enhancement and become less conspicuous during PVP and DP.
17 Buetow and colleagues stated that FNH usually appears as a homogeneous isodense lesion which shows arterial phase enhancement and becomes isodense during PVP. During DP the central scar shows enhancement.
18
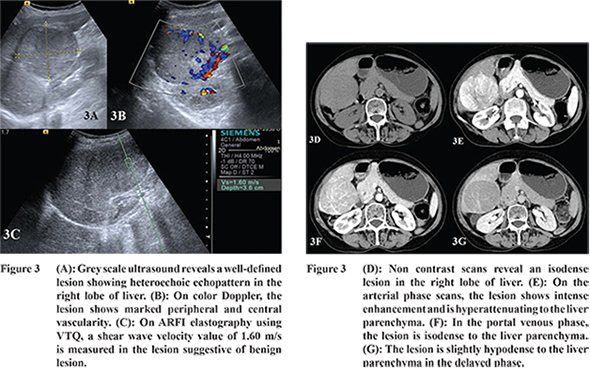
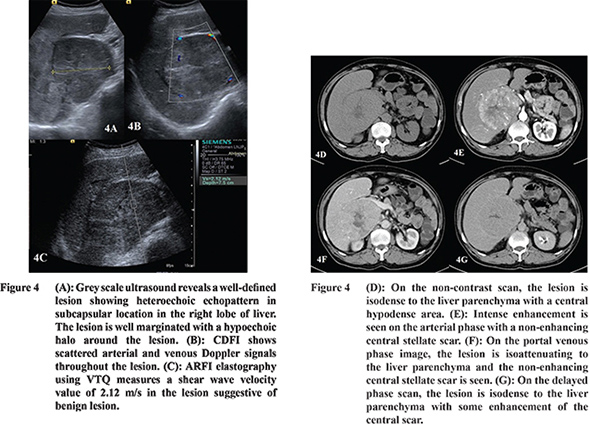
In our study, the SWV of FNH was higher as compared to that of HA (Table 2). The SWV of FNH was 2.44 m/s which was higher than the surrounding parenchyma while that of the adenoma was 1.6 m/s which was comparable to the surrounding parenchyma. Gallotti and others also found high SWV value in FNHs (2.75 ± 0.95 m/s).
19 This is because of the fibrous stroma of FNH resulting in increased stiffness compared to the adjacent parenchyma. On the other hand, adenomas showed low SWV values (1.25 ± 0.37 m/s). This is due to the presence of slightly atypical hepatocytes and less fibrous stroma.
19 The difference in SWV values between FNH and adenoma is clinically relevant as adenomas may require surgical resection owing to their propensity for hemorrhage.
The single case of liver abscess on triphasic CT revealed multiple hypodense lesions showing mild peripheral enhancement during PVP and were hypodense in DP. Wang and colleagues also found that 91.7% of abscesses showed rim enhancement.
20 The SWV of liver abscess in our study was 1.31 m/s which was comparable to that of surrounding parenchyma measuring 1.36 m/s. Our finding is in agreement with Kapoor and others who found that all abscesses in their study were soft lesions (SWV < 2 m/s).
21
Malignant lesions
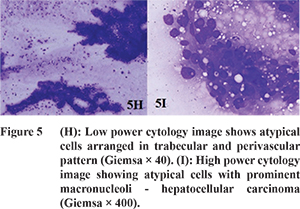
The most common enhancement pattern of HCC was arterial phase enhancement and washout in the PVP or DP images (
Figure 5). Valls et al reported that arterial hyperenhancement and hypoenhancement in PVP or DP had PPV of 93.1% for HCC.
22
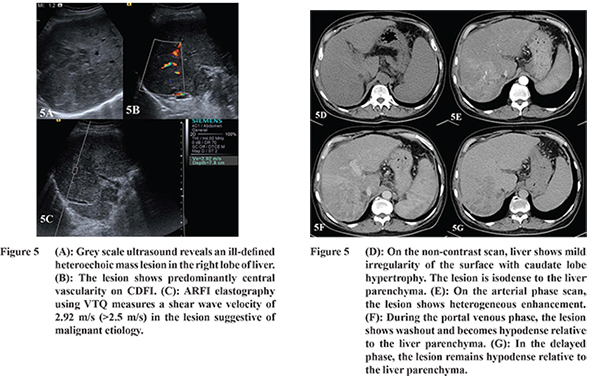
The SWV values of HCC (n=8) ranged from 1.95 to 4.3 m/s (mean, 3.45 ± 0.69 m/s) accounting for a wide range of stiffness (Table 4). Yu and Wilson also reported SWV of HCC ranging from 0.77 to 4.34 m/s (mean, 2.49 ± 1.07 m/s). The wide range of ARFI values can be explained by central necrosis resulting in low SWV values; whereas higher values may be due to the fibrous stroma and excess blood vessels.
23 The effect of surrounding parenchyma was felt to be minimal as the ROI was completely within the lesion.
23 There was no significant difference in background liver stiffness in patients with cirrhosis and non-cirrhosis. The mean SWV of HCC was significantly higher than the surrounding liver parenchyma. Cho and coworkers also found that 76% of HCCs in their study were of equal or greater stiffness than the surrounding parenchyma.
24 The two cases of cholangiocarcinoma showed multifocal hypodense lesions showing peripheral enhancement during AP and mild delayed enhancement in the DP. Lacomis and others in their study reported that 74% of cholangiocarcinoma showed delayed enhancement.
25 The SWV of two cases of cholangiocarcinoma in our study ranged from 3.23 to 3.93 m/s (mean = 3.58 ± 0.50 m/s) suggesting stiff nature of the lesion. This is due to the abundant fibrous stroma in cholangiocarcinomas. The mean SWV of cholangiocarcinoma was significantly higher than that of the surrounding liver parenchyma. Similar results were reported by Zhang et al who found SWV of cholangiocarcinoma ranging from 2.76 to 4.36 m/s (mean, 3.74 ± 0.54 m/s).
15 On triphasic CT, the most common appearance of metastases was multiple hypodense lesions in both lobes of liver which showed peripheral enhancement during AP. In the PVP and DP, majority of the lesions were hypodense relative to the liver parenchyma (
Figure 6). Nino Murcia et al reported that circumferential ring enhancement predicted malignancy with a PPV of 98% and specificity of 93%.
3 Although all cases of metastases were detected by triphasic CT, one case was incorrectly interpreted as focal nodular hyperplasia on triphasic CT due to intense heterogeneous enhancement during AP. The lesion was isodense during PVP and DP with a central hypodense area. On histopathological analysis however it was diagnosed as metastatic adenocarcinoma.
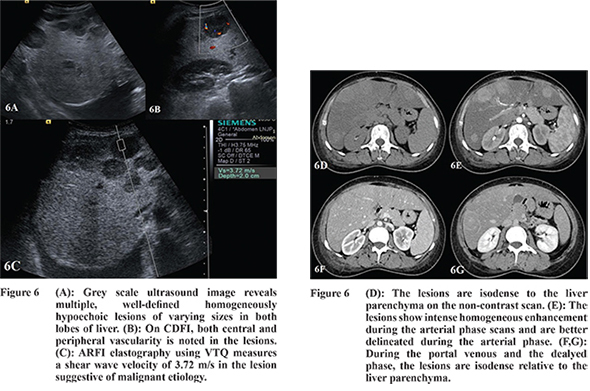
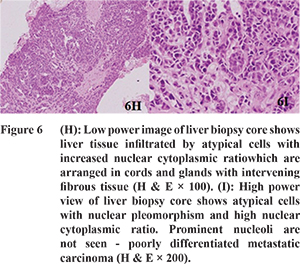
The SWVs of the metastases (n=16) ranged from 2.25 to 3.84 m/s (mean, 3.14 ± 0.48 m/s) (
Table 4). The mean SWV of the metastases was significantly higher than that of the surrounding liver parenchyma. This is due to the fibrotic stroma causing increased stiffness of metastasis. Gallotti and colleagues in their study found mean SWV of 3.20±0.62 (range = 2.22-4.36 m/s) in 39 cases of metastases.
19 In our study, two of the malignant lesions showed low SWV values. On histopathological analysis the lesions were diagnosed as metastatic adenocarcinoma and HCC. The low SWV value in the case of metastatic adenocarcinoma can be explained by the presence of extracellular mucin in the tumor resulting in softer nature of the lesion. Similar findings have been reported by Frulio et al who reported that three cases of metastatic adenocarcinoma showed median SWV value of less than 2 m/s. Wide range of SWV values in metastasis are seen depending upon the amount of fibrous stroma and mucoids components.
26 In the case of HCC, the presence of necrosis in the lesion may have resulted in a low SWV value. Frulio et al, in their study, found that 55.6% of HCCs had SWV value < 2m/s.
26 In the present study, mean SWV value for malignant lesions (mean ± SD, 3.27 ± 0.56) was significantly higher than that for benign lesions (1.78 ± 0.49). Using the ROC curve, the cut-off level for SWV value for malignancy with highest sensitivity and specificity was estimated to be 2.44 m/s. Thus, using the ROC curves with this cut-off value, the SWV value predicted malignancy with a sensitivity of 92.3%, specificity of 91.7% and an accuracy of 92.1%. The PPV and NPV with this cut-off value was 96% and 84.6% respectively. Our findings are in agreement with the reports of several previous studies.1,13 Shuang-Ming et al in their study reported that with a cutoff value of 2.22 m/sec for SWV value, the sensitivity, specificity, and accuracy for malignancy were 89.7%, 95.0%, and 92.2%, respectively.
27 Our study had some limitations. Some liver lesions could not be evaluated by ARFI because these lesions were deeper than 8.0 cm from the skin and were not accessible to SWV measurement due toattenuation of the signal. Additionally, patients who had poor breath hold also could not be properly evaluated by ARFI, because the ARFI is sensitive to motion during measurement. Further the wide range of etiological conditions and the resulting limited numbers for some lesion types was also a limitation in the study.
Thus, our study showed that triphasic CT enables evaluation of enhancement of the lesions in various phases which helps in the characterisation of liver lesions. ARFI can provide quantitative information regarding the tissue stiffness of focal liver lesions which is helpful in the differentiation between benign and malignant focal lesions.
References
- Park H, Park JY, Kim do Y, Ahn SH, Chon CY, Han KHet al. Characterization of focal liver masses using acoustic radiation force impulse elastography. World J Gastroenterol. 2013;19(2):219-26.
- Leeuwen MS, Noordzij J, Feldberg MAM, Hennipman AH, Doornewaard H. Focal liver lesions?: characterisation with triphasic spiral CT. Radiology. 1996;201:327-36.
- Nino-Murcia M, Olcott EW, Jeffrey RB, Lamm RL, Beaulieu CF, Jain KA. Focal liver lesions: pattern-based classification scheme for enhancement at arterial phase CT. Radiology. 2000;215(3):746-51.
- Jang HJ, Kim TK, Khalili K, Yazdi L, Menezes R, Park SH et al. Characterization of 1-to 2-cm liver nodules detected on HCC surveillance ultrasound according to the criteria of the American Association for the Study of Liver Disease: is quadriphasic CT necessary? AJR Am J Roentgenol. 2013;201(2):314-21.
- Garra BS, Cespedes EI, Ophir J, Spratt SR, Zuurbier RA, Magnant CM, et al. Elastography of breast lesions: initial clinical results. Radiology. 1997;202:79-86.
- Xu JM, Xu XH, Xu HX, ZhangYF, Zhang J, Guo LHet al.Conventional US, US Elasticity Imaging, and Acoustic Radiation Force Impulse Imaging for Prediction of Malignancy in Thyroid Nodules. Radiology. 2014;272:577-86.
- Sandrin L, Fourquet B, Hasquenoph JM, Yon S, Fournier C, Mal F et al. Transient elastography: a new noninvasive method for assessment of hepatic fibrosis. Ultrasound Med Biol. 2003;29(12):1705-13.
- Zheng X, Ji P, Mao H, Hu J.A comparison of virtual touch tissue quantification and digital rectal examination for discrimination between prostate cancer and benign prostatic hyperplasia. Radiol Oncol. 2012;46(1):69-74.
- de Korte CL, Pasterkamp G, van der Steen AFW, Woutman HA, Bom N. Characterization of plaque components with intravascular ultrasound elastography in human femoral and coronary arteries in vitro. Circulation. 2000;102:617-23.
- De Zordo T, Fink C, Feuchtner GM,Smekal V, Reindl M, Klauser AS. Real-time sonoelastography findings in healthy Achilles tendons. AJR Am J Roentgenol. 2009;193:W134-8.
- Foucher J, Chanteloup E, Vergniol J, Castera L, Le Bail BL, Adhoute X et al. Diagnosis of cirrhosis by transient elastography (FibroScan): a prospective study. Gut. 2006;55:403-8.
- Gheorghe L, Iacob S, Iacob R, Dumbrava M, Becheanu G, Herlea V et al. Real time elastography - a non-invasive diagnostic method of small hepatocellular carcinoma in cirrhosis. J Gastrointestin Liver Dis. 2009;18(4):439-46.
- Davies G, Koenen M. Acoustic radiation force impulse elastography in distinguishing hepatic haemangiomata from metastases: preliminary observations. Br J Radiol. 2011;84:939-43.
- Friedrich-Rust M, Wunder K, Kriener S, Sotoudeh F, Richter S, Bojunga J, et al. Liver fibrosis in viral hepatitis : noninvasive assessment with acoustic radiation force impulse imaging versus transient elastography. Radiology. 2009;252(2):595-604.
- Zhang P, Zhou P, Tian S-M, Qian Y, Deng J, Zhang L. Application of acoustic radiation force impulse imaging for the evaluation of focal liver lesion elasticity. Hepatobiliary Pancreat Dis Int. 2013;12(2):165-70.
- Heide R, Strobel D, Bernatik T, GoertzRs. Characterization of focal liver lesions (FLL) with acoustic radiation force impulse (ARFI) elastometry. Ultraschall Med. 2010;31(4):405-9.
- Grazioli L, Federle MP, Ichikawa T, Balzano E, Nalesnik M, Madariaga J. Liver adenomatosis: clinical, histopathologic, and imaging findings in 15 patients. Radiology. 2000;216(2):395-402.
- Buetow PC, Pantongrag-Brown L, Buck JL, Ros PR, Goodman ZD. Focal nodular hyperplasia of the liver: radiologic-pathologic correlation. Radiographics. 1996;16:369-88.
- Gallotti A, D’Onofrio M, Romanini L, Cantisani V, Mucelli RP. Acoustic radiation force impulse (ARFI) ultrasound imaging of solid focal liver lesions. Eur J Radiol. 2012;81(3):451-5.
- Wang CL, Guo XJ, Qiu SB, Lei Y, Yuan ZD, Dong HB, et al. Diagnosis of bacterial hepatic abscess by CT. Hepatobiliary Pancreat Dis Int. 2007;6(3):271-5.
- Kapoor A, Kapoor A, Mahajan G, Sidhu BS, Lakhanpal VP. Real-time elastography in differentiating metastatic from non-metastatic liver nodules. Ultrasound Med Biol. 2011;37(2):207-13.
- Valls C, Cos M, Figueras J, Andía E, Ramos E, Sánchez A, et al. Pretransplantation diagnosis and staging of hepatocellular carcinoma in patients with cirrhosis: value of dual-phase helical CT. AJR Am J Roentgenol. 2004;182(4):1011-7.
- Yu H, Wilson SR. Differentiation of benign from malignant liver masses with acoustic radiation force impulse technique. Ultrasound Q. 2011;27(4):217-23.
- Cho SH, Lee JY, Han JK, Choi BI. Acoustic radiation force impulse elastography for the evaluation of focal solid hepatic lesions: preliminary findings. Ultrasound Med Biol. 2010;36(2):202-8.
- Lacomis JM, Baron RL, Oliver JH, Nalesnik MA, Federle MP. Cholangiocarcinoma: delayed CT contrast enhancement patterns. Radiology. 1997;203:98-104.
- Frulio N, Laumonier H, Carteret T, Laurent C, Maire F, Balabaud C, et al. Evaluation of liver tumors using acoustic radiation force impulse elastography and correlation with histologic data. J Ultrasound Med. 2013;32:121-30.
- Shuang-Ming T, Ping Z, Ying Q, Li-Rong C, Ping Z, Rui-Zhen L. Usefulness of acoustic radiation force impulse imaging in the differential diagnosis of benign and malignant liver lesions. Acad Radiol. 2011;18(7):810-5.